Ask
Start a thread and say what you want to see, in your own words. "Yesterday around 14:00" means 14:00 where you are.


Self-hosted. Your data sources, your model, your server.
Every query is test-run before you see it. Pinned dashboards open with no model involved.
You ask: What happened to checkout yesterday around 14:00?
Plan · 3 panels
sum(rate(http_requests_total{service="checkout",code=~"5.."}[5m])) query ran · 212 ms histogram_quantile(0.95, rate(http_duration_bucket{service="checkout"}[5m])) query ran · 148 ms select at, version from deploys where service = 'checkout' query ran · 9 ms One Docker image, for linux/amd64 and linux/arm64.
docker run -d --name quanthea -p 3000:3000 \
  -v quanthea-data:/data \
  -v quanthea-keys:/keys \
ghcr.io/jboix/quantheaThe first start creates the user admin and writes its password to the log, once:
docker logs quanthea 2>&1 | grep password
Sign in at http://localhost:3000 as admin with that password. quanthea then asks
for your own email and password. To declare users, sources and the model in a file, see
the deployment guide.
Start a thread and say what you want to see, in your own words. "Yesterday around 14:00" means 14:00 where you are.
The agent proposes the panels and their queries before it builds anything. You approve, or ask for changes.
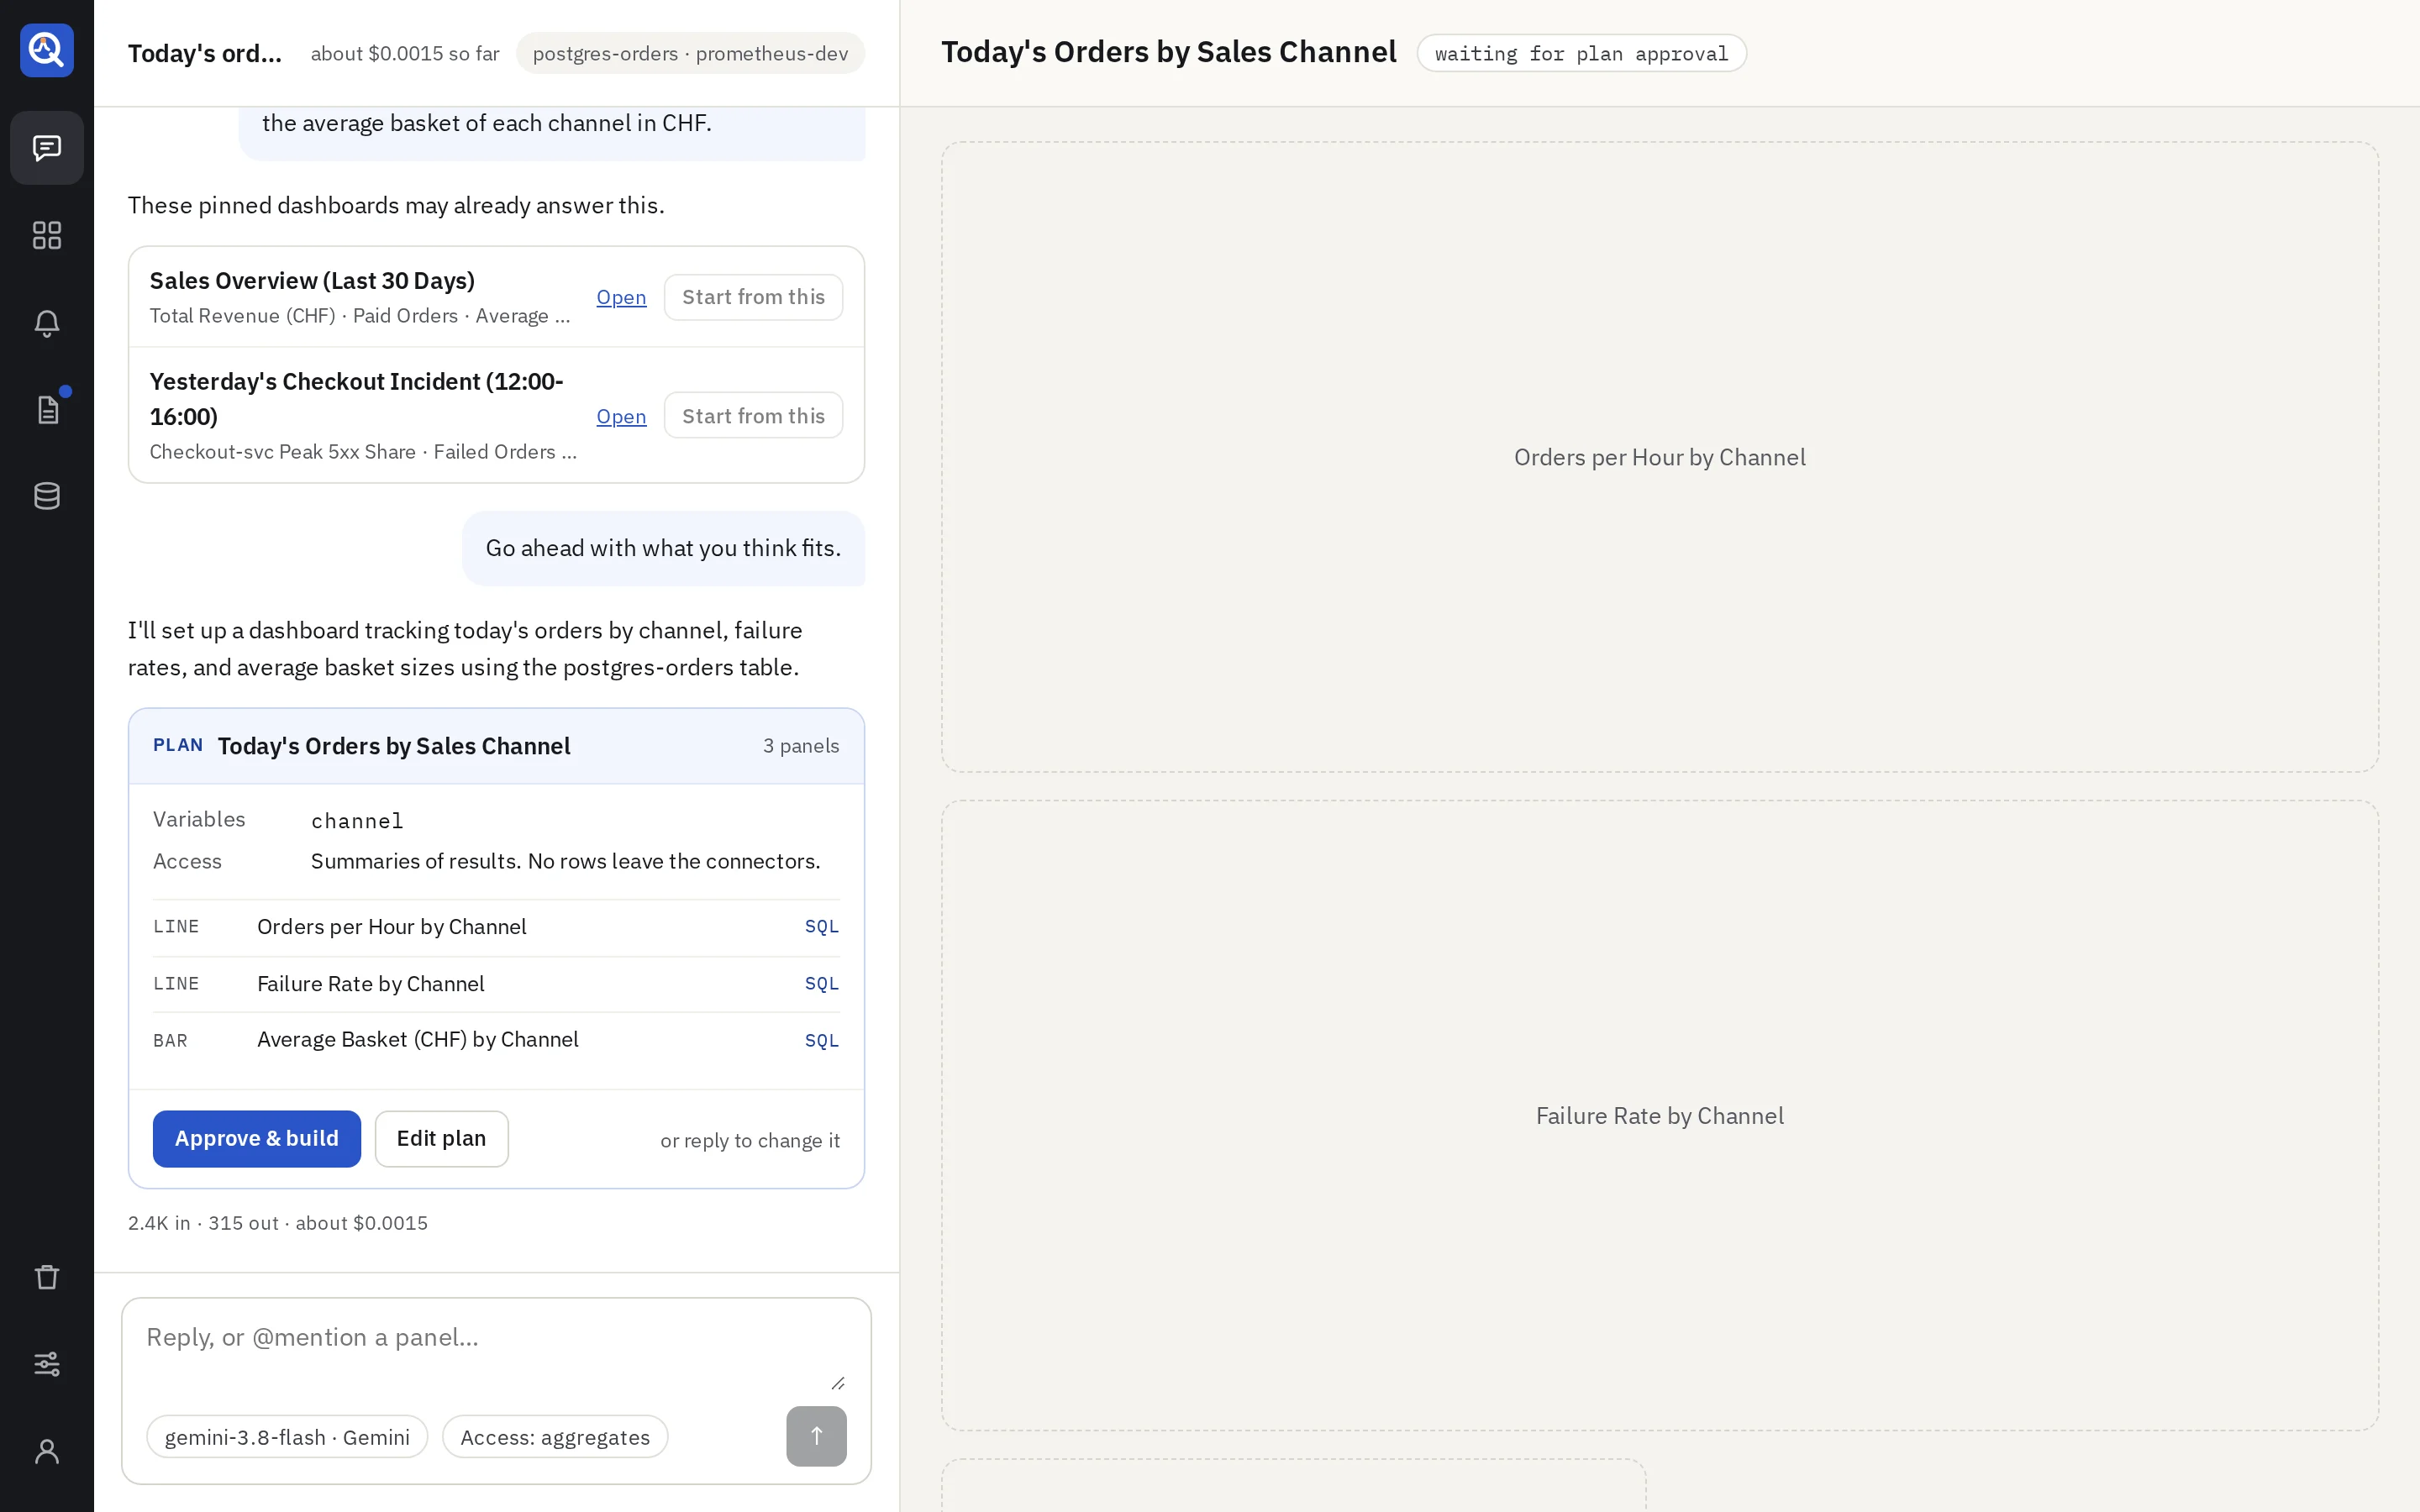

Each query is test-run against your source as the dashboard appears beside the thread. Ask for changes in the same thread, and mention a panel with @ to change just that one.
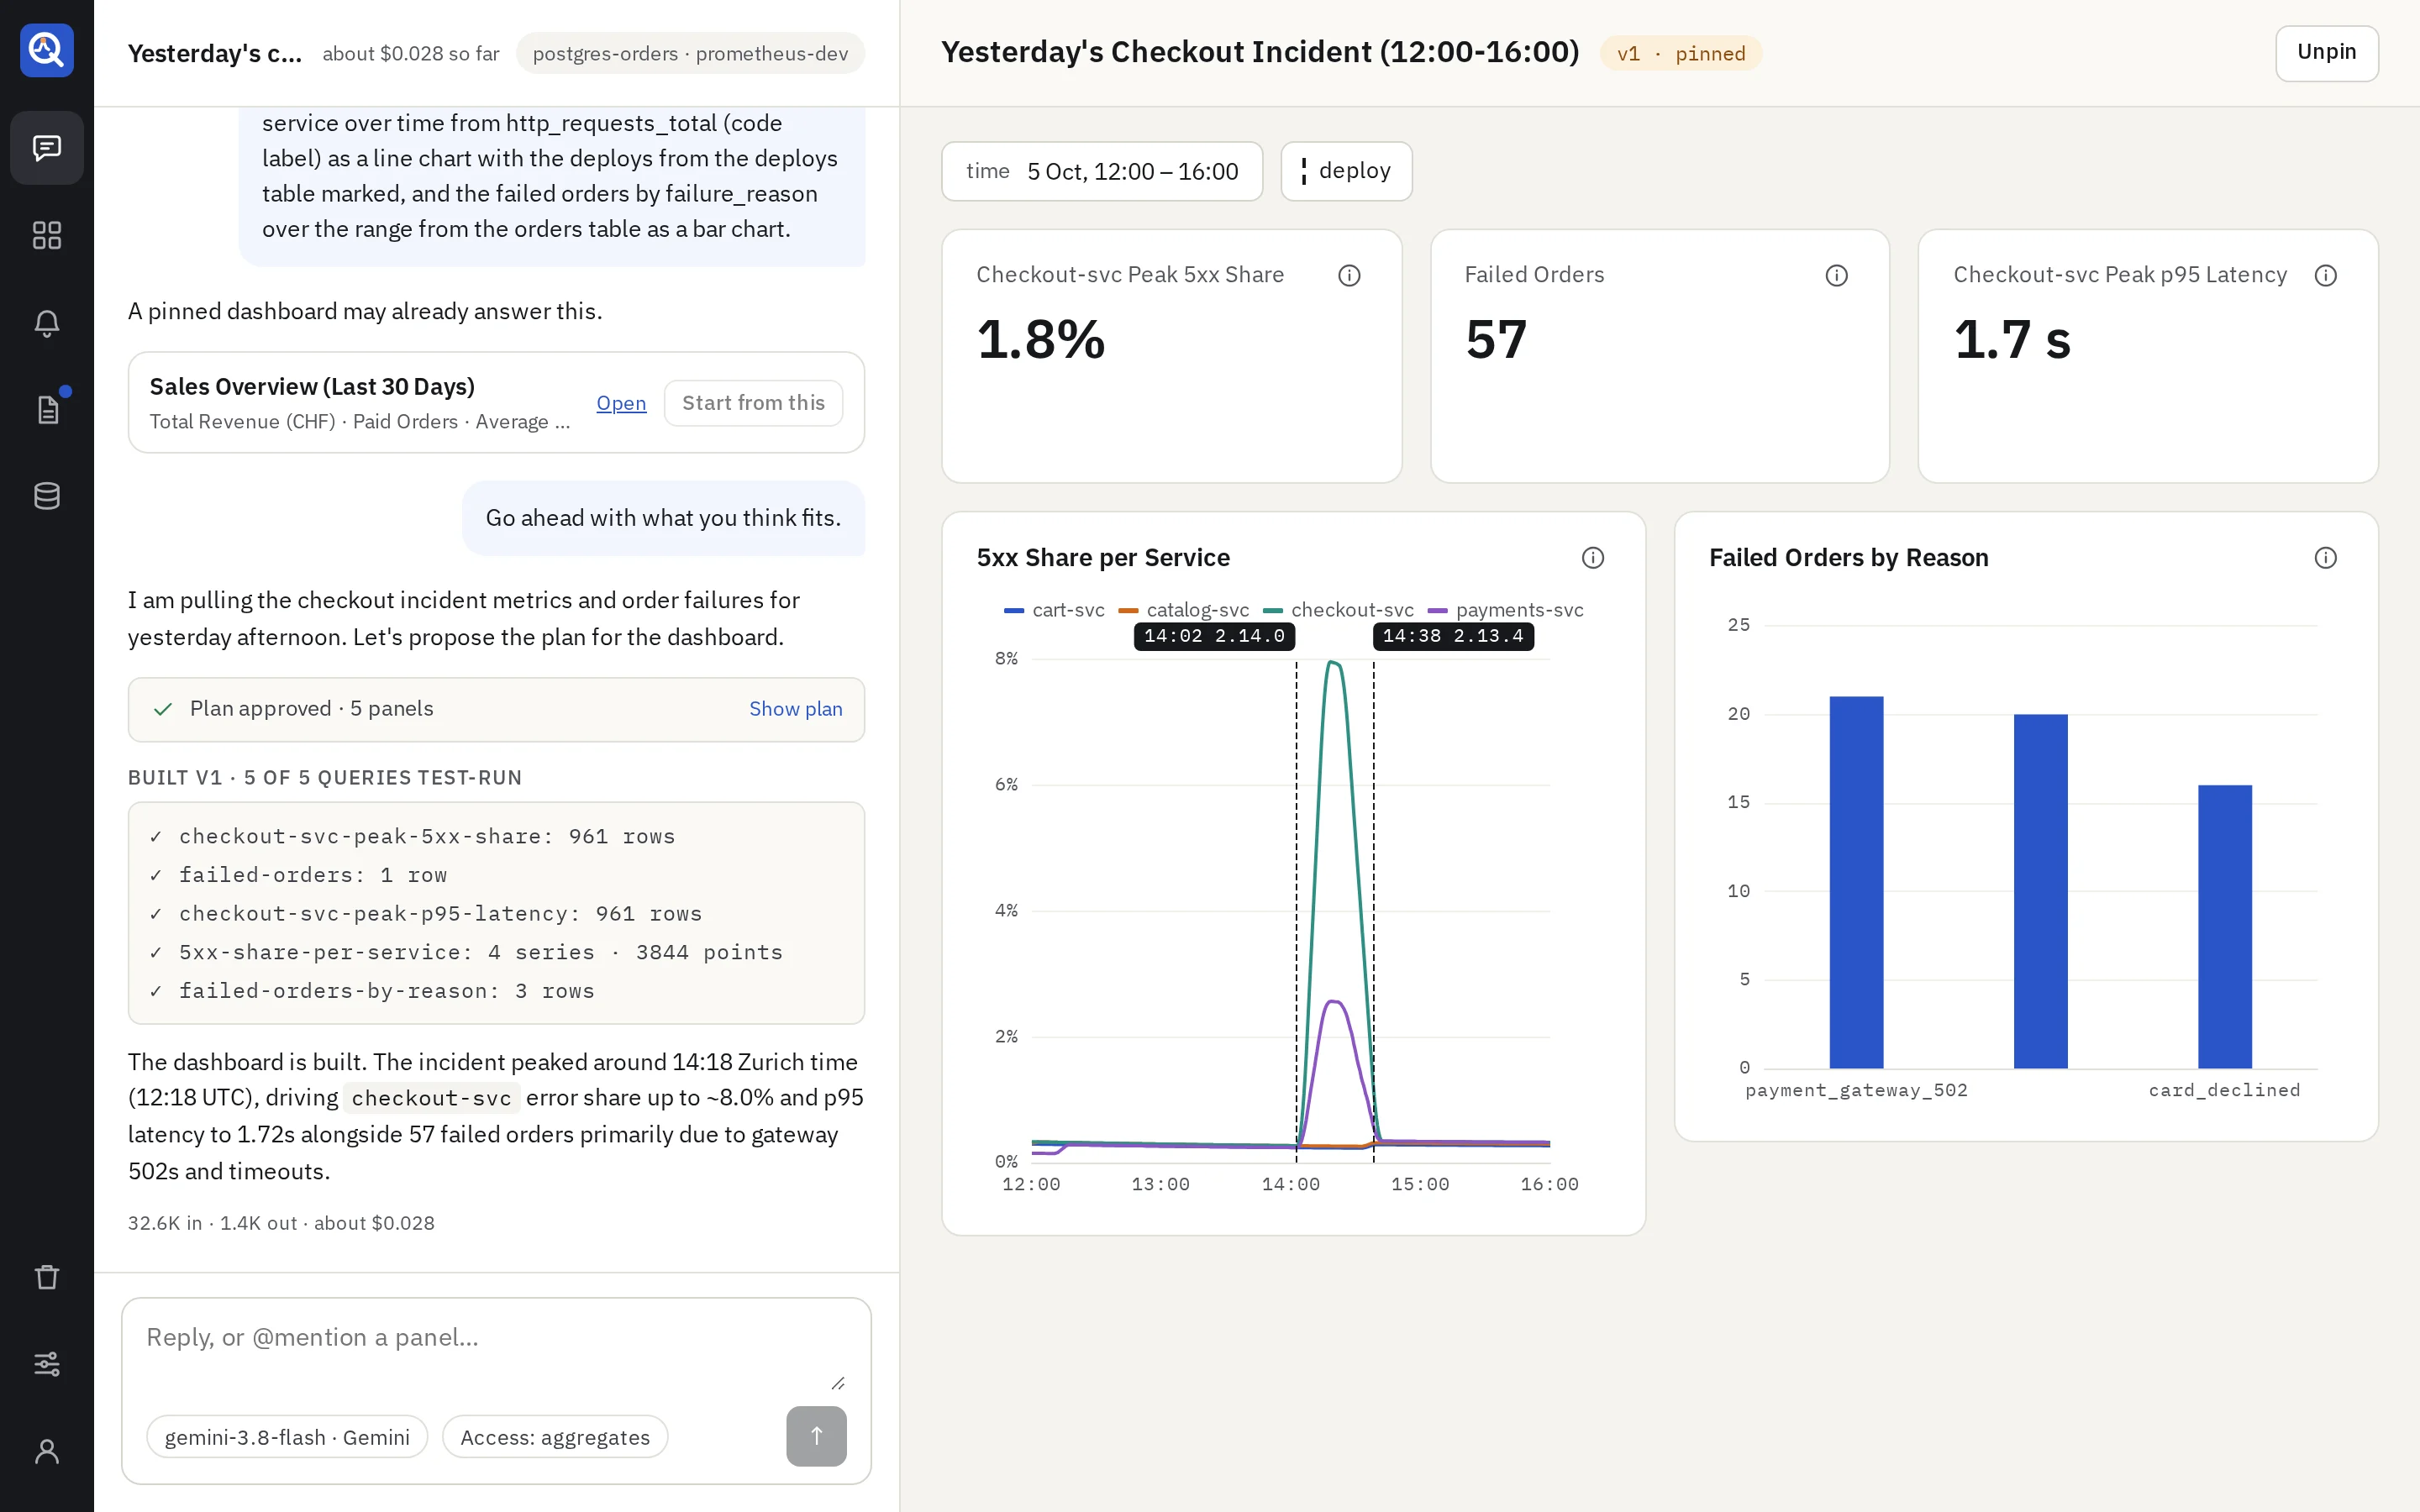

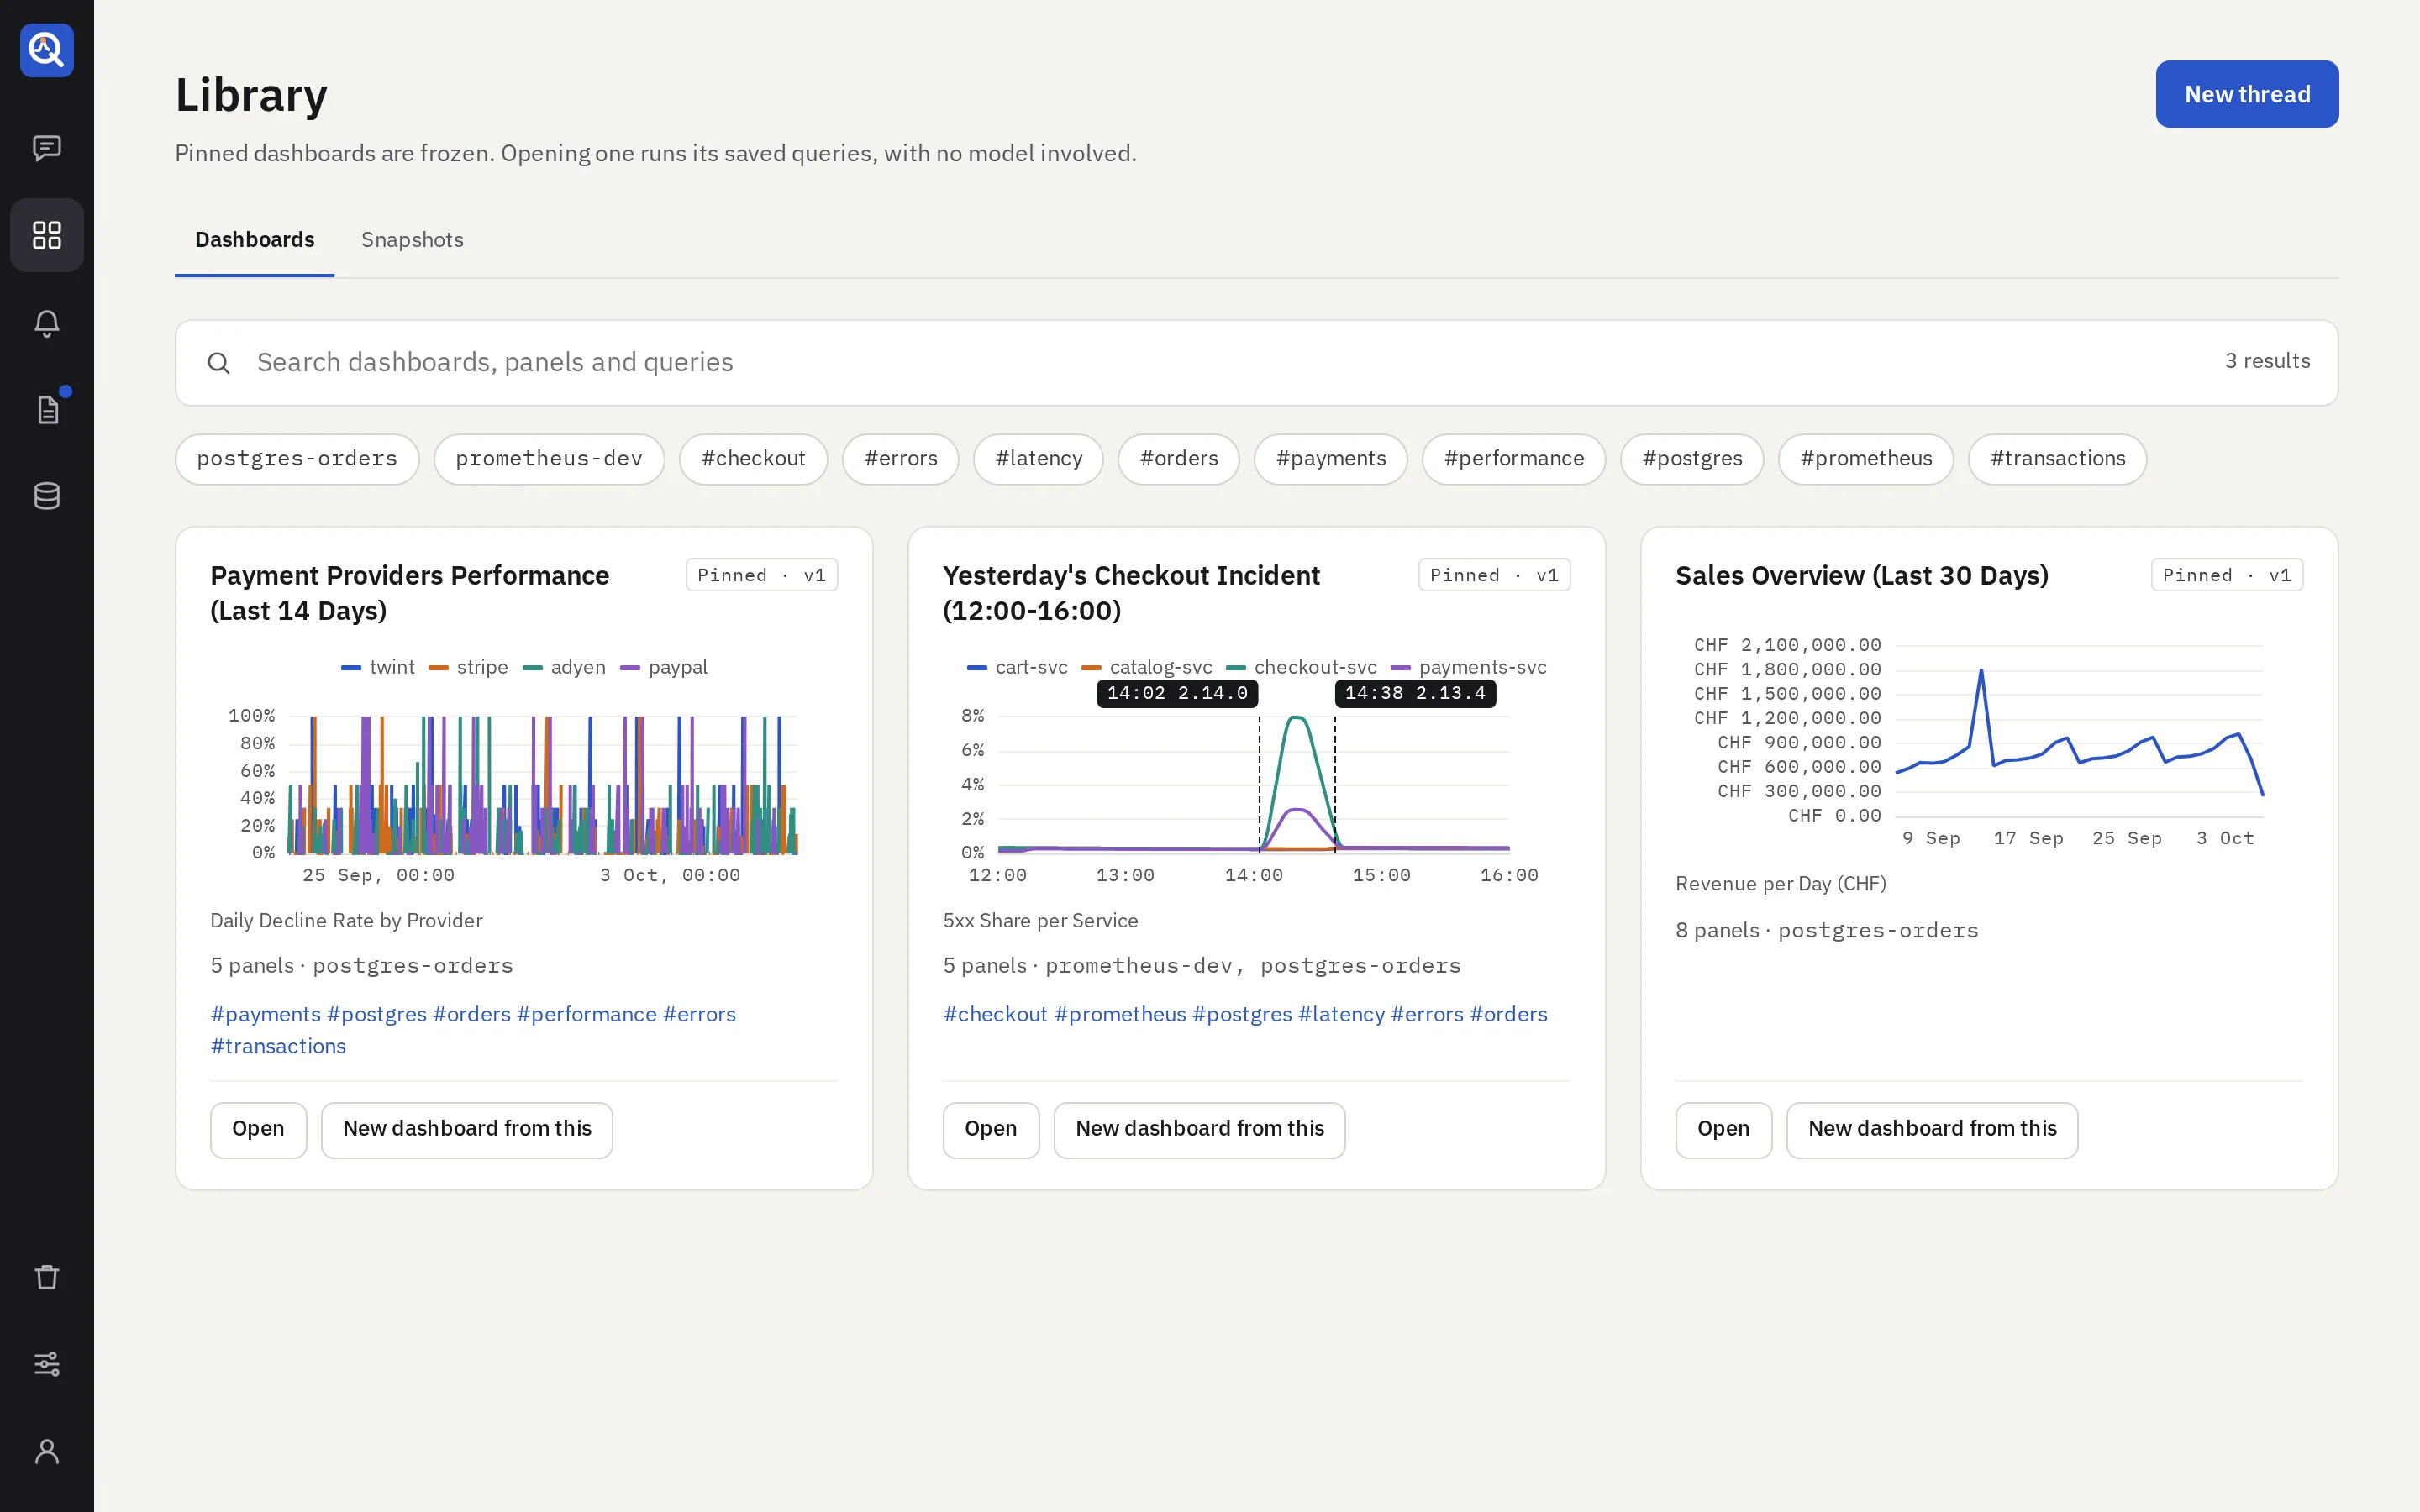
Pinned dashboards go to the library: versioned, searchable by panel and query, and shown without any model.

Only when you build, ask a question or have a panel explained. Nothing runs in the background.
Building a dashboard, an alert or a report in a thread, asking about a dashboard, and explaining a panel use your model. It sees only what the access gate returns.
Opening a pinned dashboard, checking an alert and running a report use no model. They cost no tokens, and keep working when the model is down.
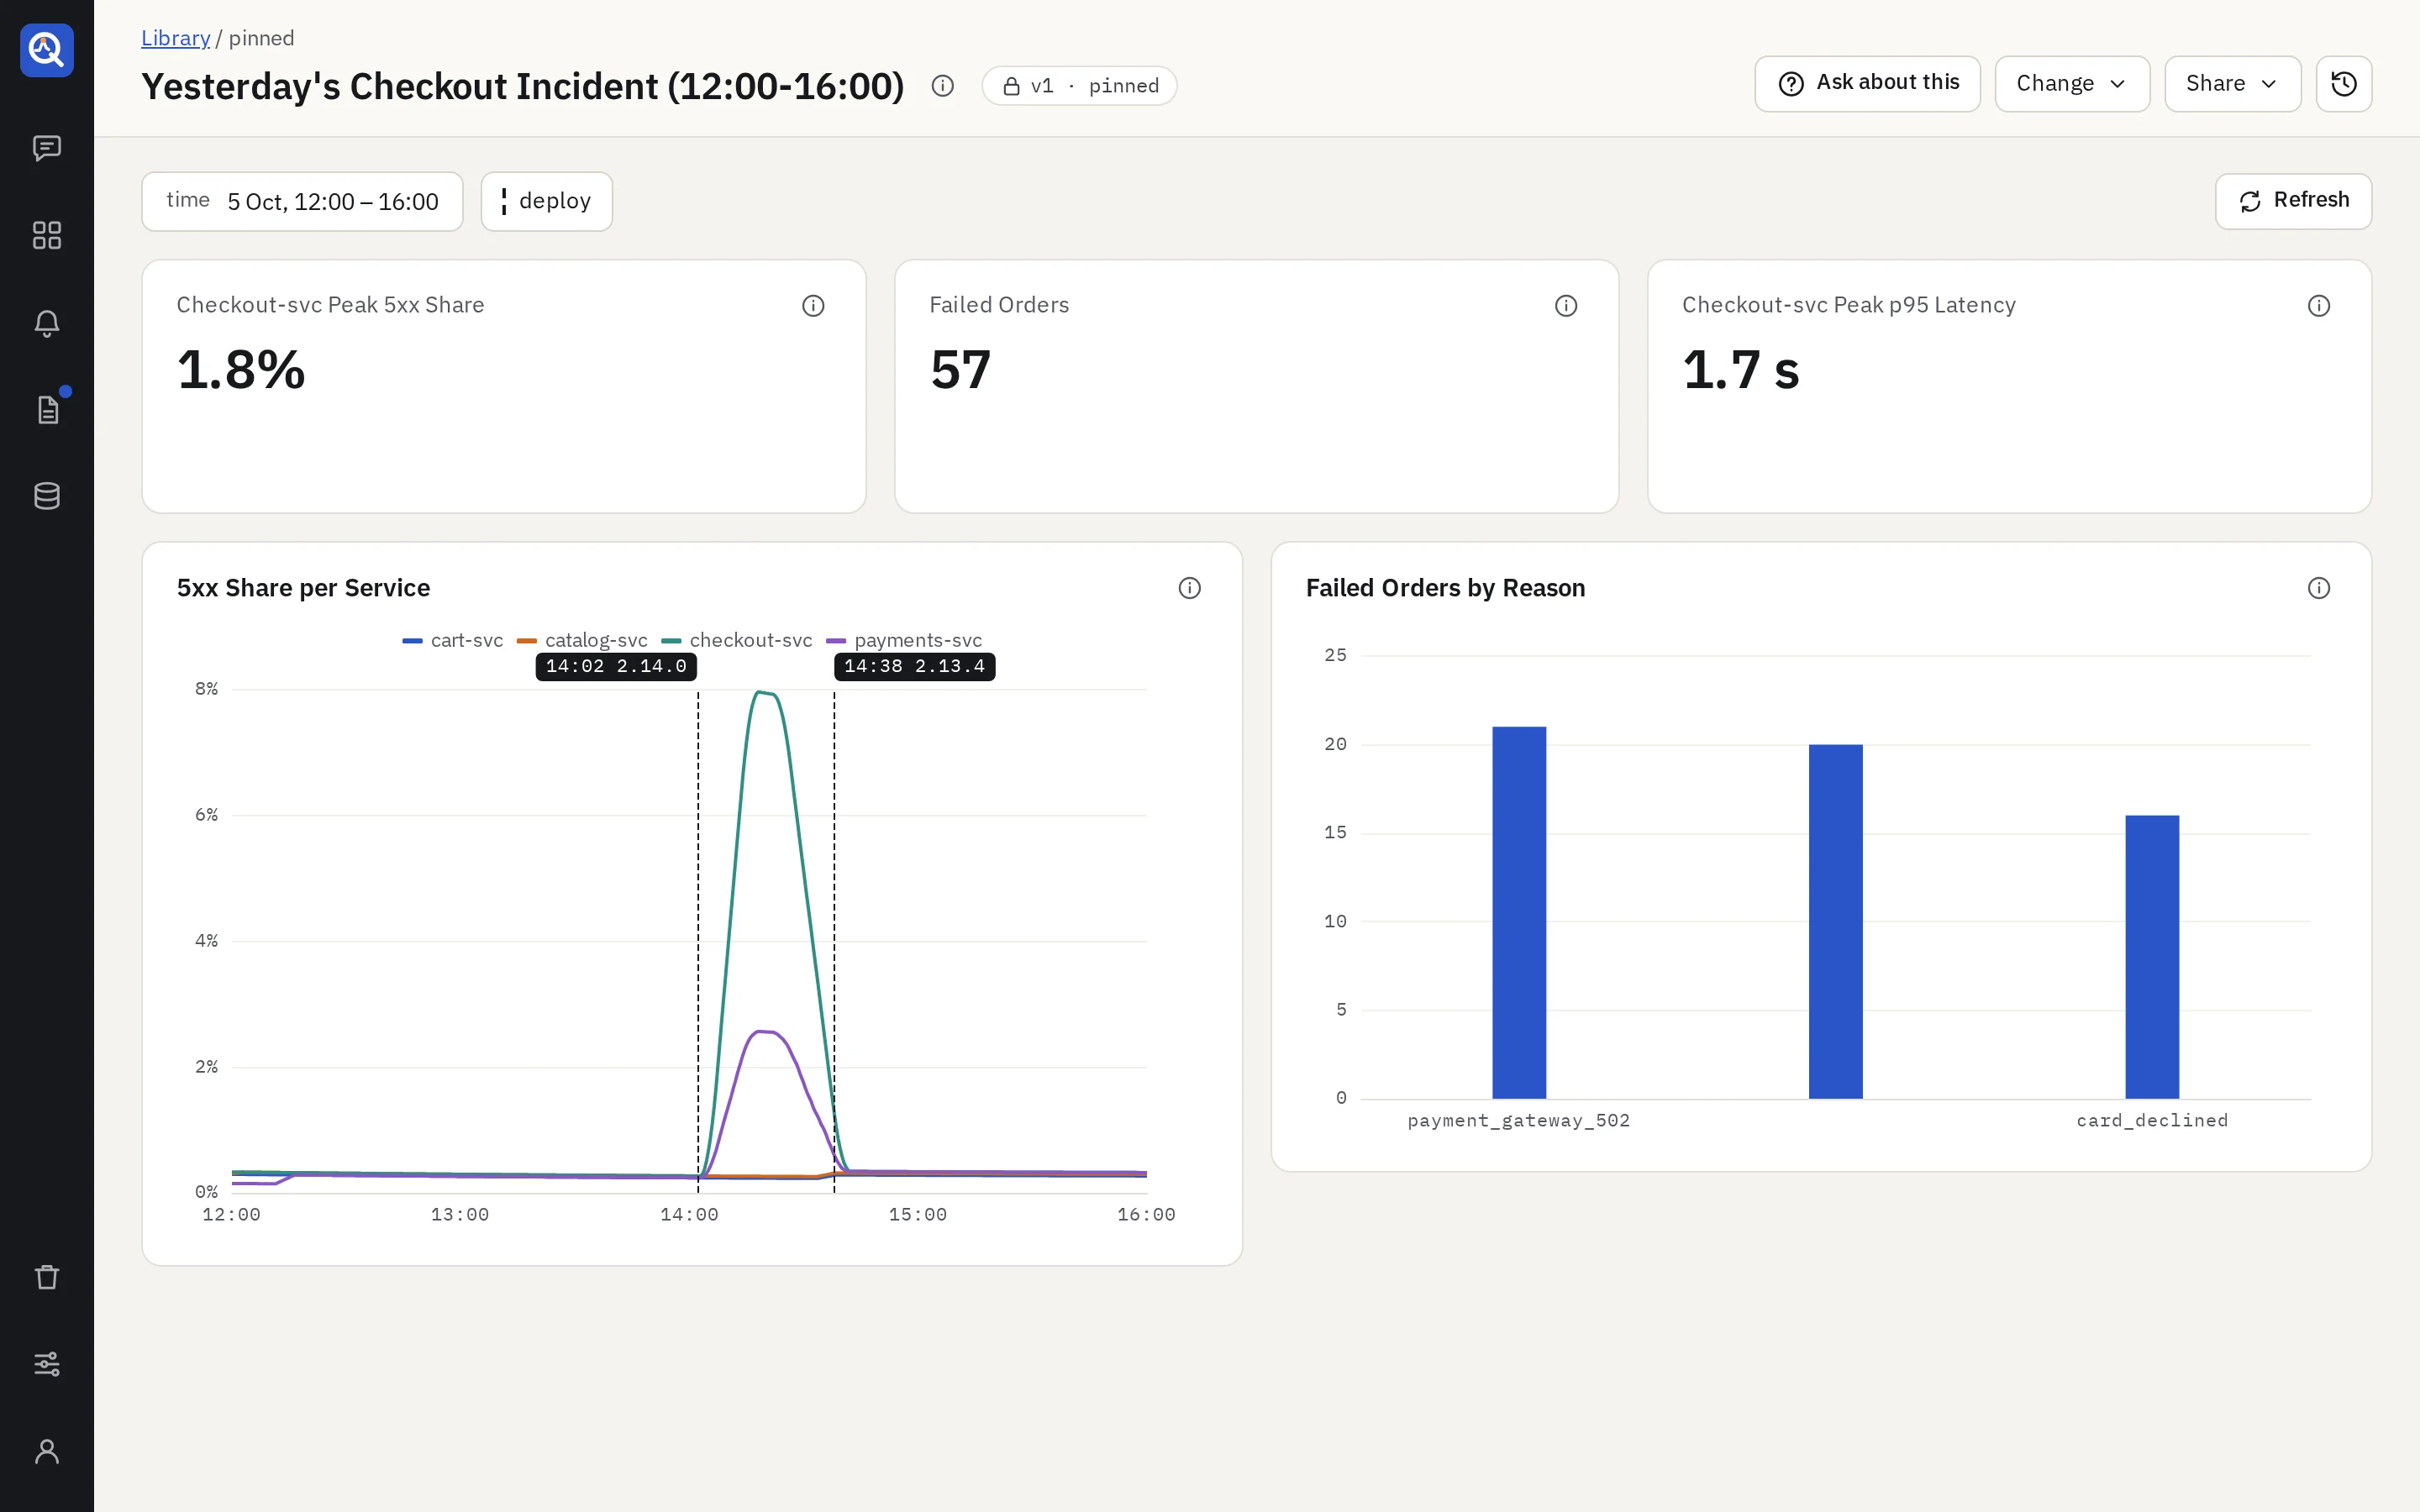

The agent plans, builds and test-runs every query before you see a panel. Refine the dashboard in the same thread.
Read more about chat-built dashboardsECharts with the spec’s 16 series types, plus stat and table panels, variables and annotations.
Pinned dashboards are versioned and searchable by panel and query. History keeps every version, and any version can be pinned.
Read more about dashboard libraryWritten in a chat, checked on a schedule with no model. Start one from any dashboard panel.
Read more about alertsA set of panels on a schedule, compared with the period before and sent to your channels. Each run uses no model.
Read more about reportsAlerts and reports go to the channels you set up.
Ask questions about a pinned dashboard, or have a panel explained.
Read more about ask and explainA version frozen with its data, behind a link you can share and revoke.
Read more about snapshotsGemini and local models work through an OpenAI-compatible endpoint.
Four roles: viewer, analyst, editor, admin. No dashboard belongs to anyone.
Write a connector against @quanthea/plugin-kit and test it with its conformance suite.
npm create @quanthea/plugin
Read more about plugins 14 sources out of the box, read with read-only credentials.
Credentials, names and emails are sealed with a key kept apart from the data.
The agent reaches your data only through the access gate, at the level you set per connector.
Viewers, analysts, editors and admins. Every API route declares the role it needs.
Set the new secret key and the old one, restart once, then remove the old one.